Shifting Winds
Gendered Structures of Academic Mentorship
Every researcher alive today had their mentors, those who helped assimilate them into a life of scholarly work. And in turn they each had their mentors, and so on to the dawn of knowledge. In the same way, each researcher’s mentees take their perspectives and methods to future mentees, and to their mentees, etc.
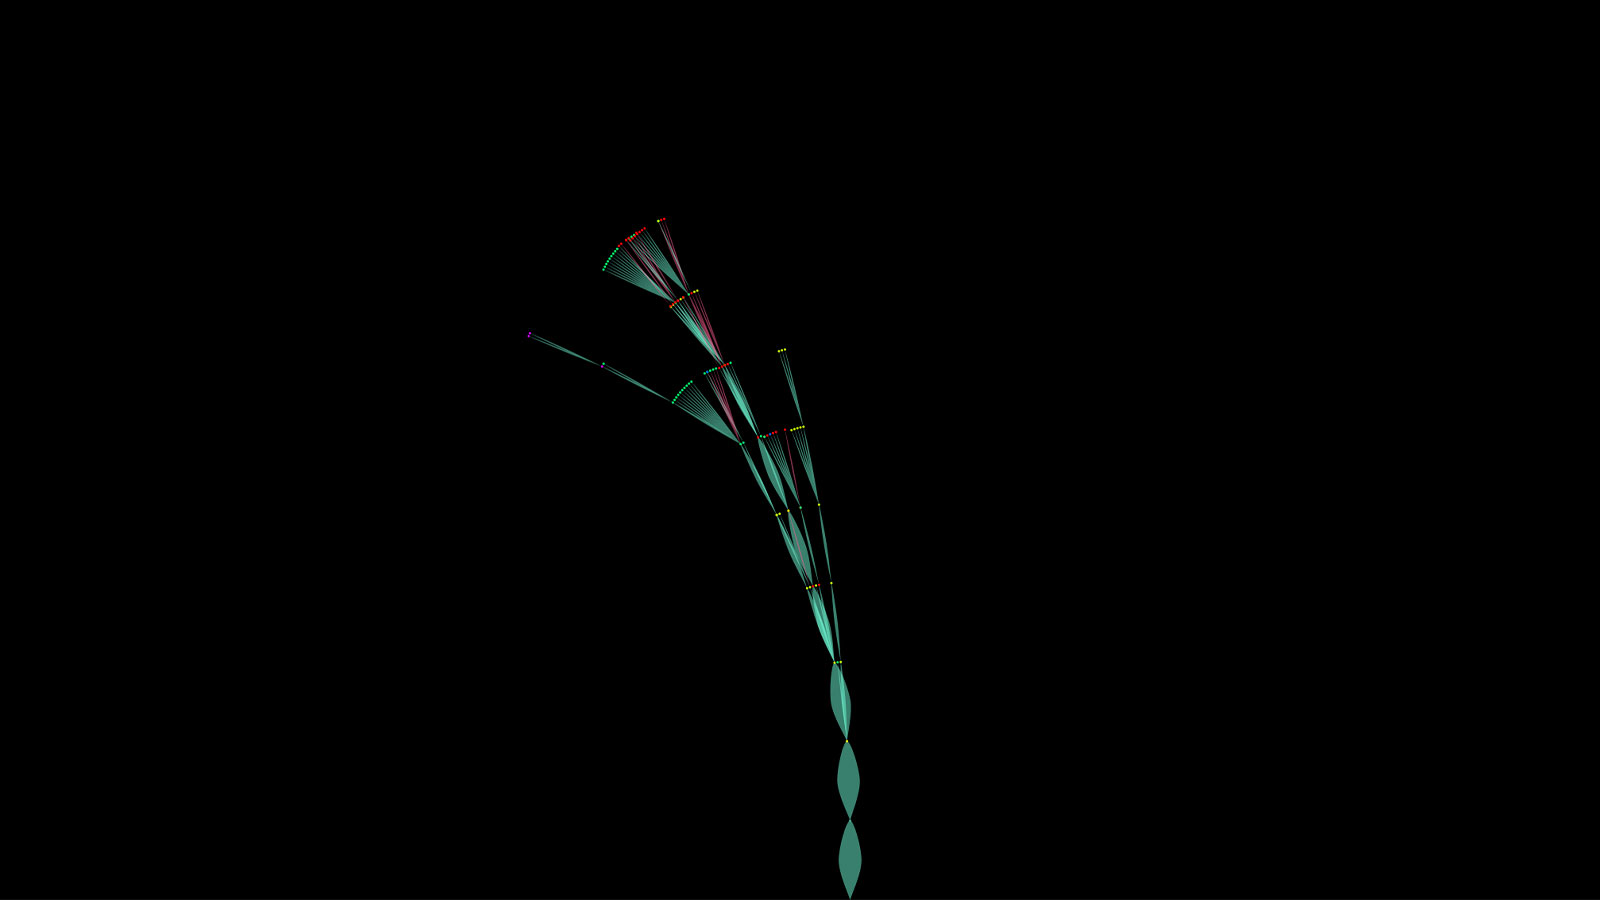
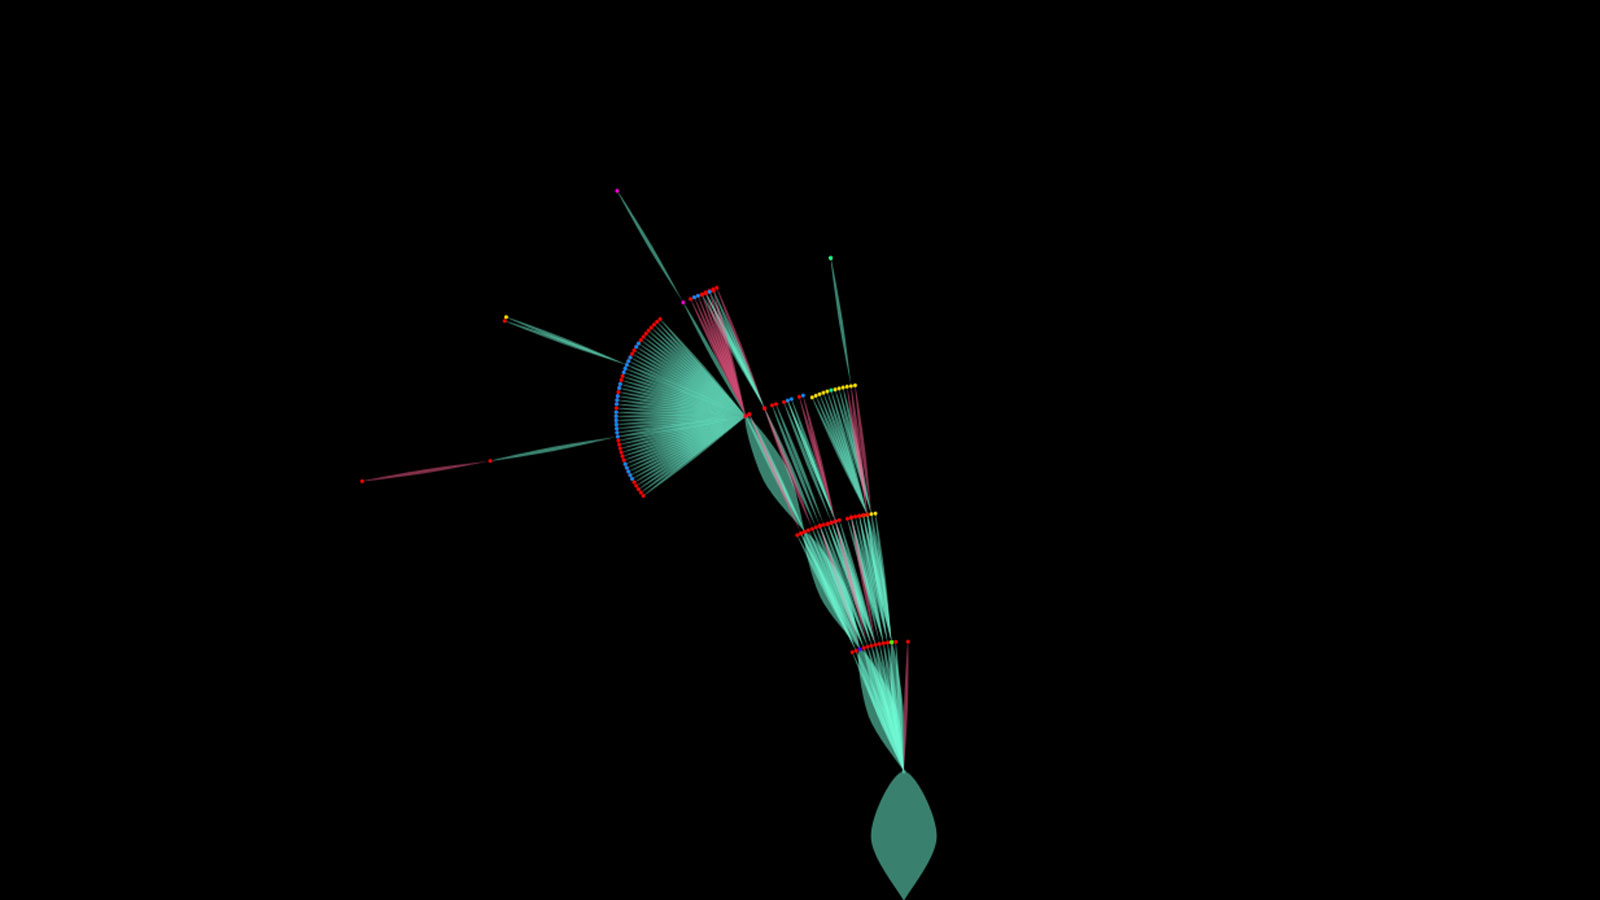
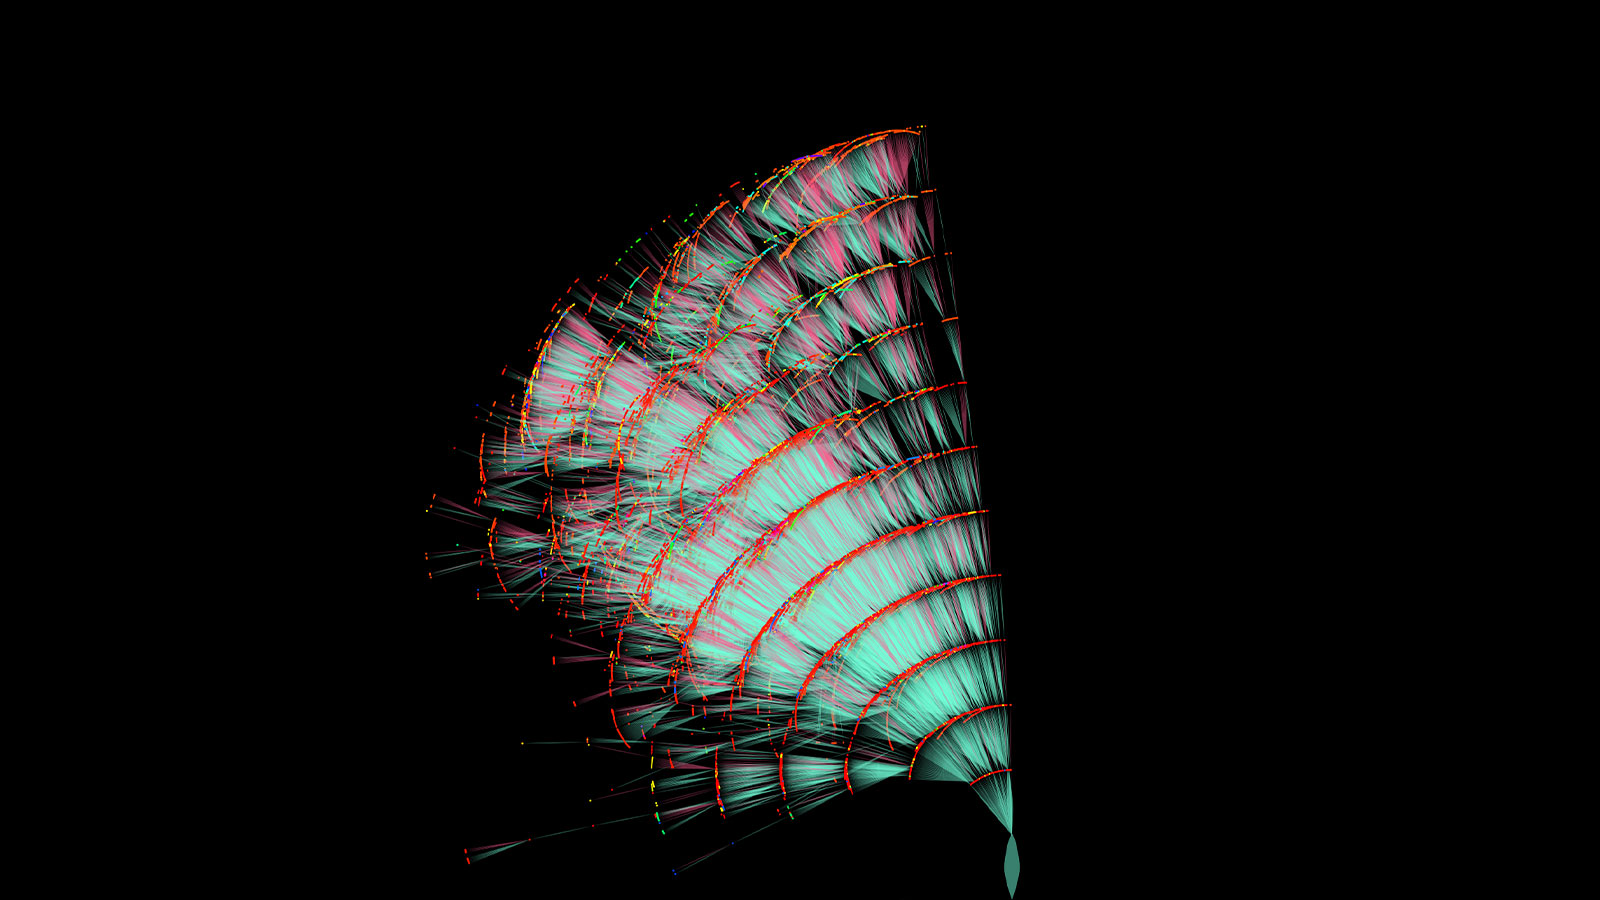
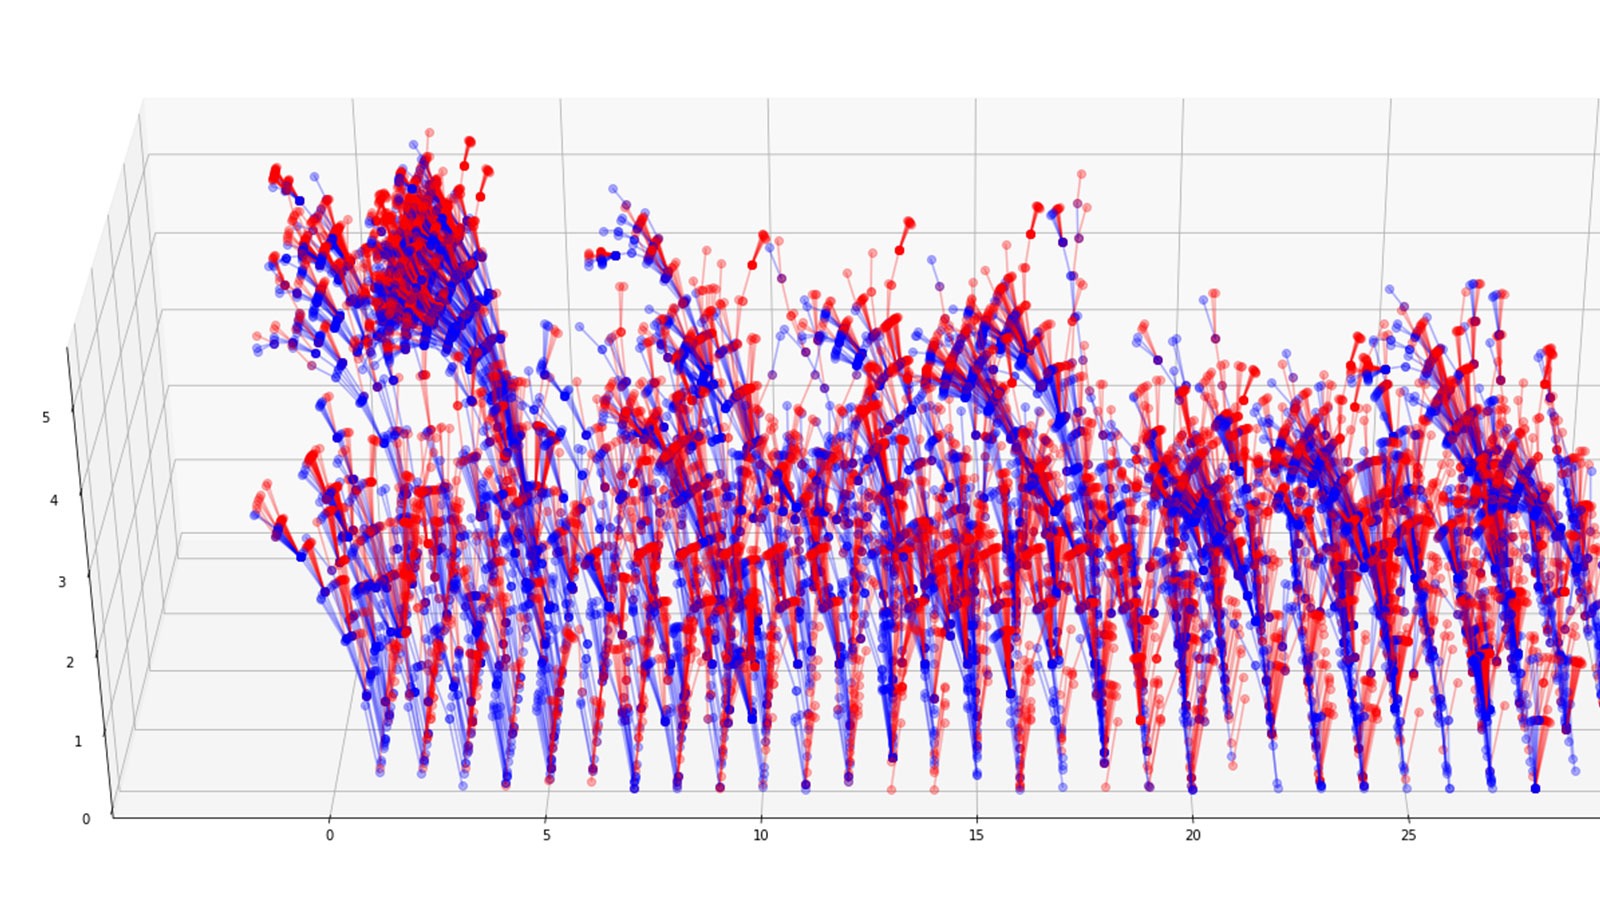
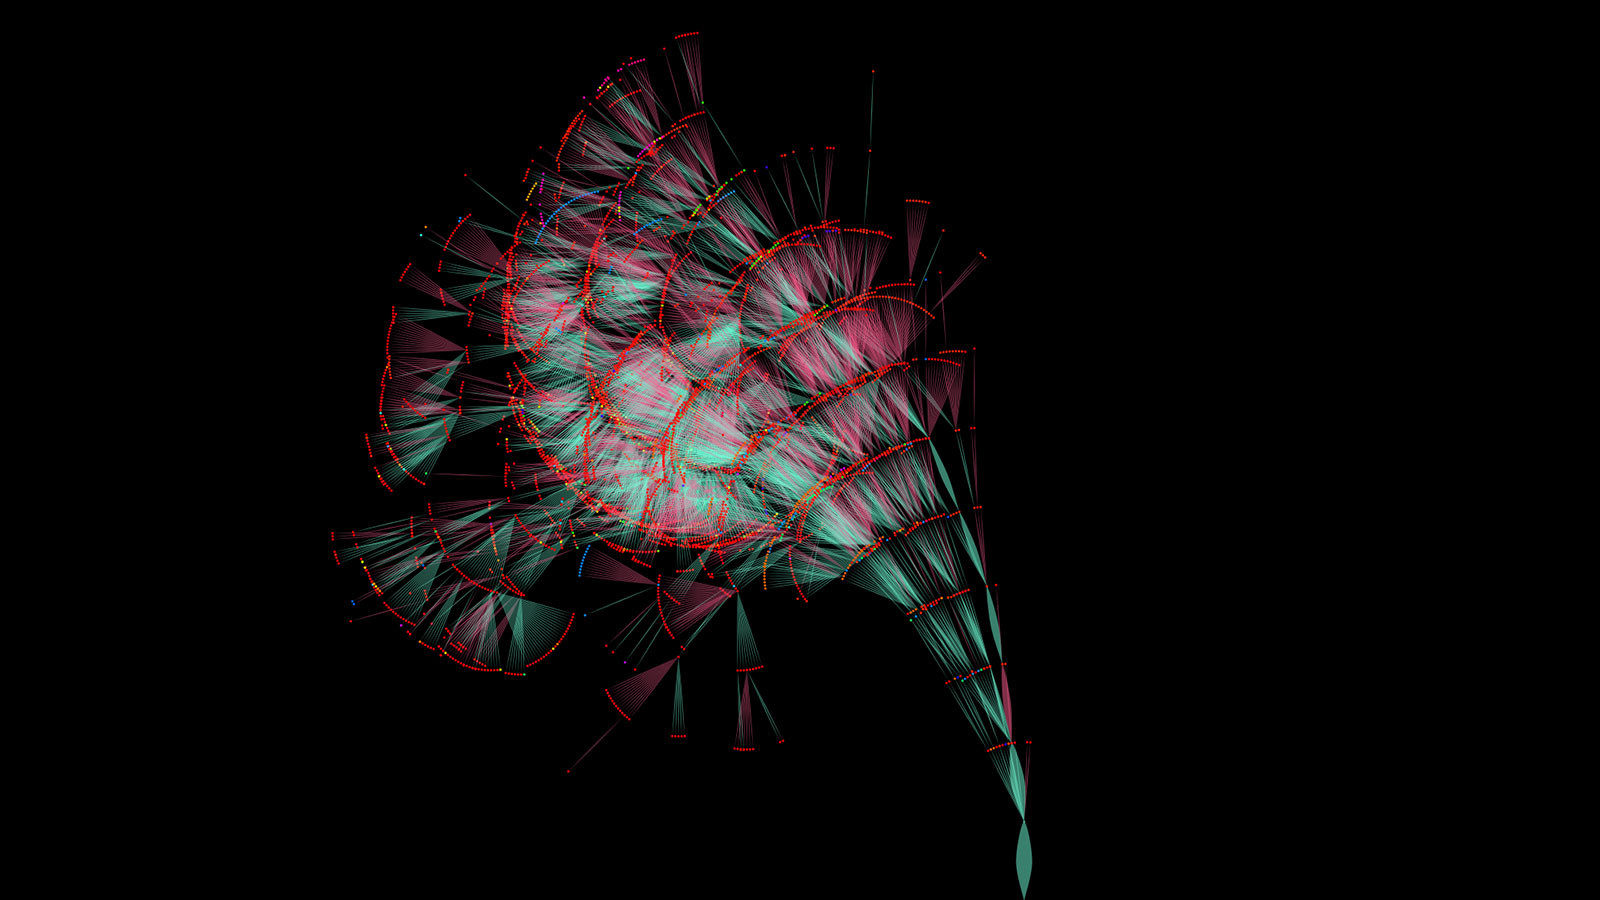
These comprise the roots and branches, respectively, of the academic tree of a single researcher. If we let these ancestors’ and descendants’ genders affect these trees like a “wind,” most curl nearly to the earth. We depict and describe the structure of these trees, and how this wind has changed over the decades. To set these trees growing upright again we visualize giving differential weight to male and female researchers.
Publications & Presentations
[Design] Mentor Trees Website
Data Processing and Visualization
The MENTORSHIP dataset which we use is based on the Academic Family Tree, a crowdsourced effort to collect aca- demic genealogy. Registered users can input, update, or confirm the information posted there. This includes relational data, keeping track of advisors and their advisees, collaborators, research assistants, and postdoctoral students. The dataset now holds 774,733 researchers in total across 112 fields.
To narrow down the scope of visualizations and make sure that the mentorship data contains relatively complete and correct information for visualization, we investigate only the most represented research areas. These research areas are anthropology, cell biology, chemistry, computer science, engineering, history, linguistics, literature, math, microbiology, neuroscience, nursing, philosophy, physics, political science, and sociology.
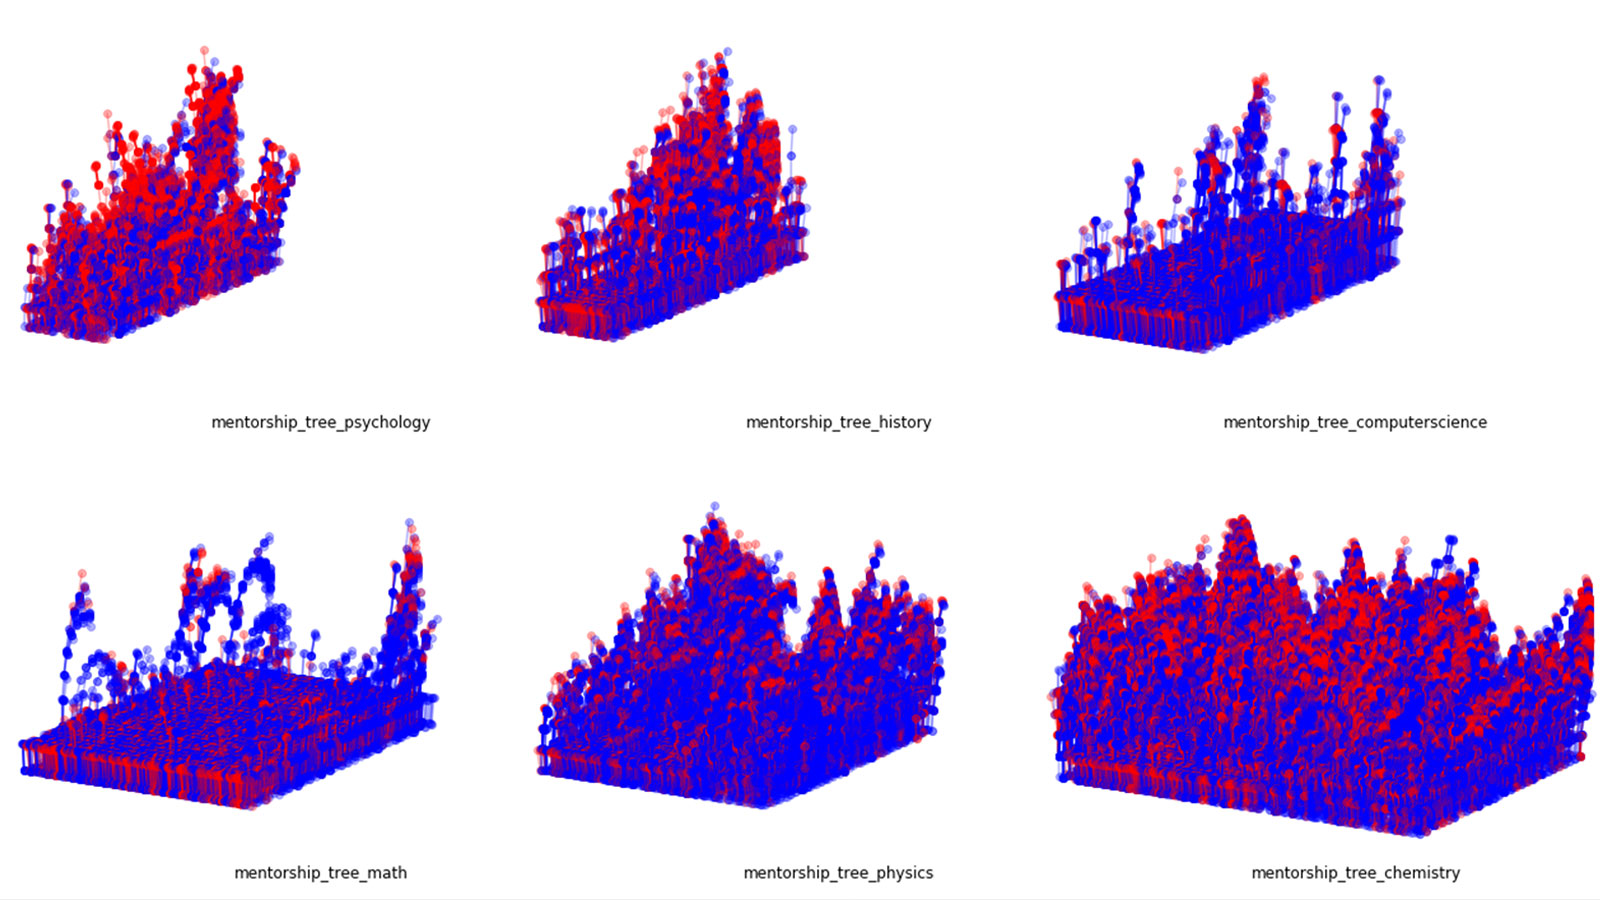
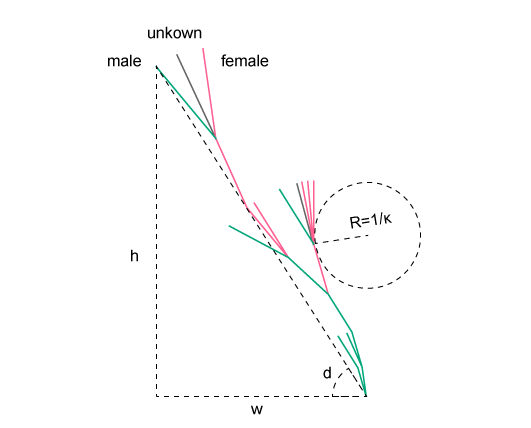
We draw these trees with equal female and male curls, and record their width and height. We also record the radius and curvature of each mentee in the tree (see Figure 1). The tallest and widest trees, then, correspond to the maximum height and width of these drawn trees across 16 research fields. By averaging the radius of curvature over all mentees in each tree, we find the most tilted trees, to the right and to the left. And by computing the standard deviation of all curvature for each datapoint, we find the most diverse tree, the tree with the most variation in curl amongst its mentees. We depict the widest and tallest tree, the most tilted trees, and the most diverse tree on the website. All code for generating these visualizations is available online.
Visuals
