Visualizing Covidcookery
What are People Eating during the Lockdown?
Home-cooking has become as a way to pass hours and feel productive, a form to entertain ourselves, and even an outlet to channel all the anxieties. Sharing food, as well as sharing food experiences can help create a new sense of community while people are isolated.
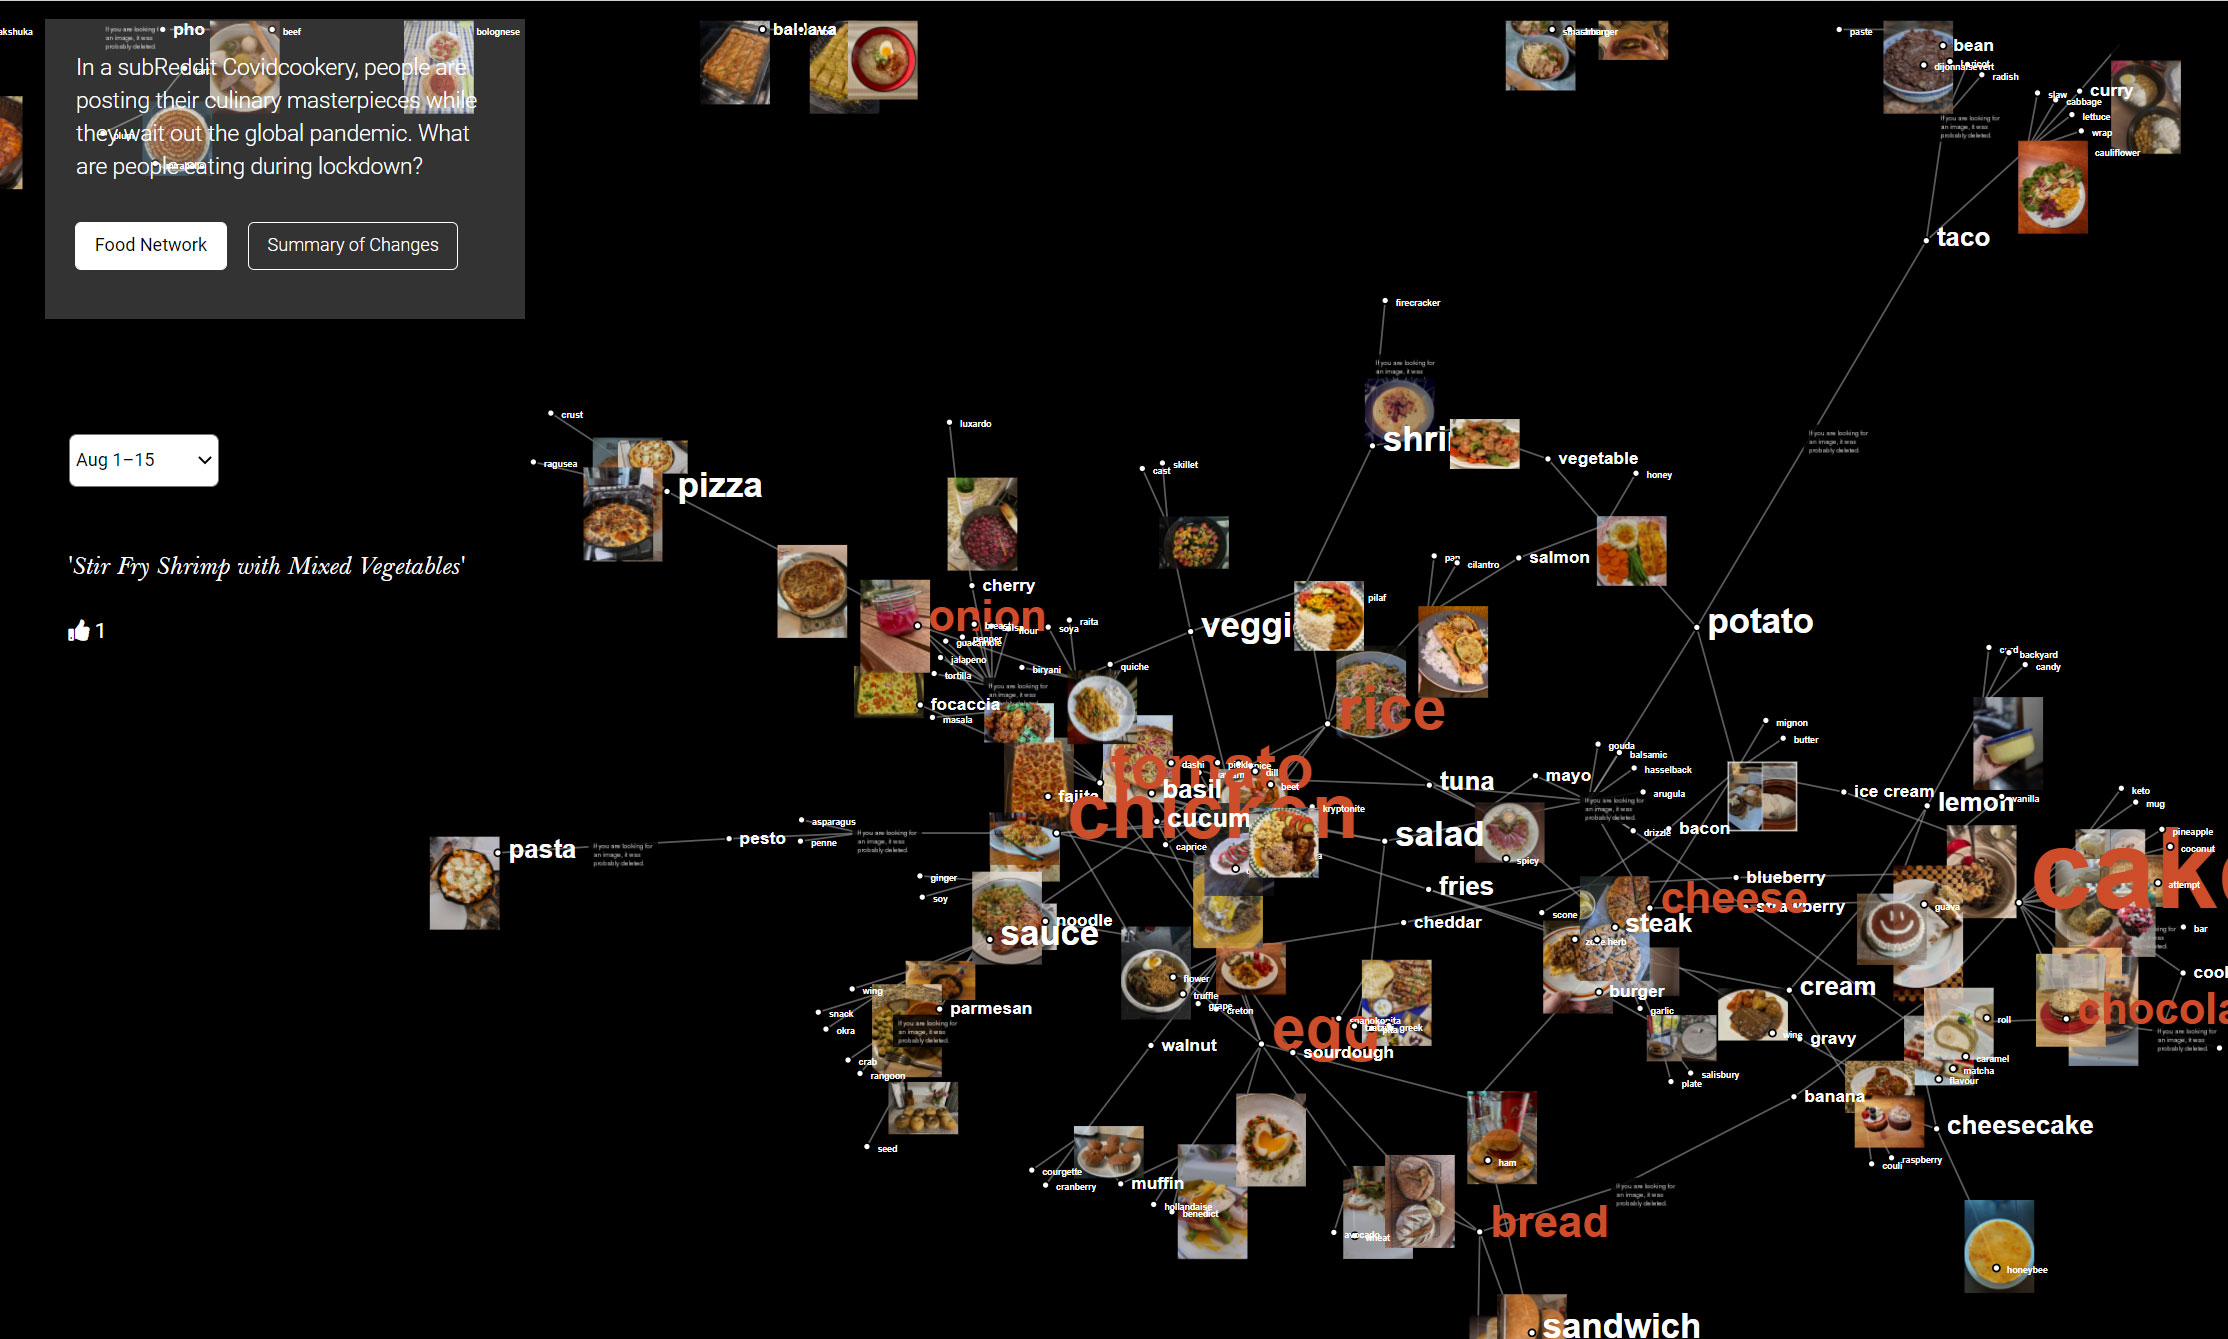
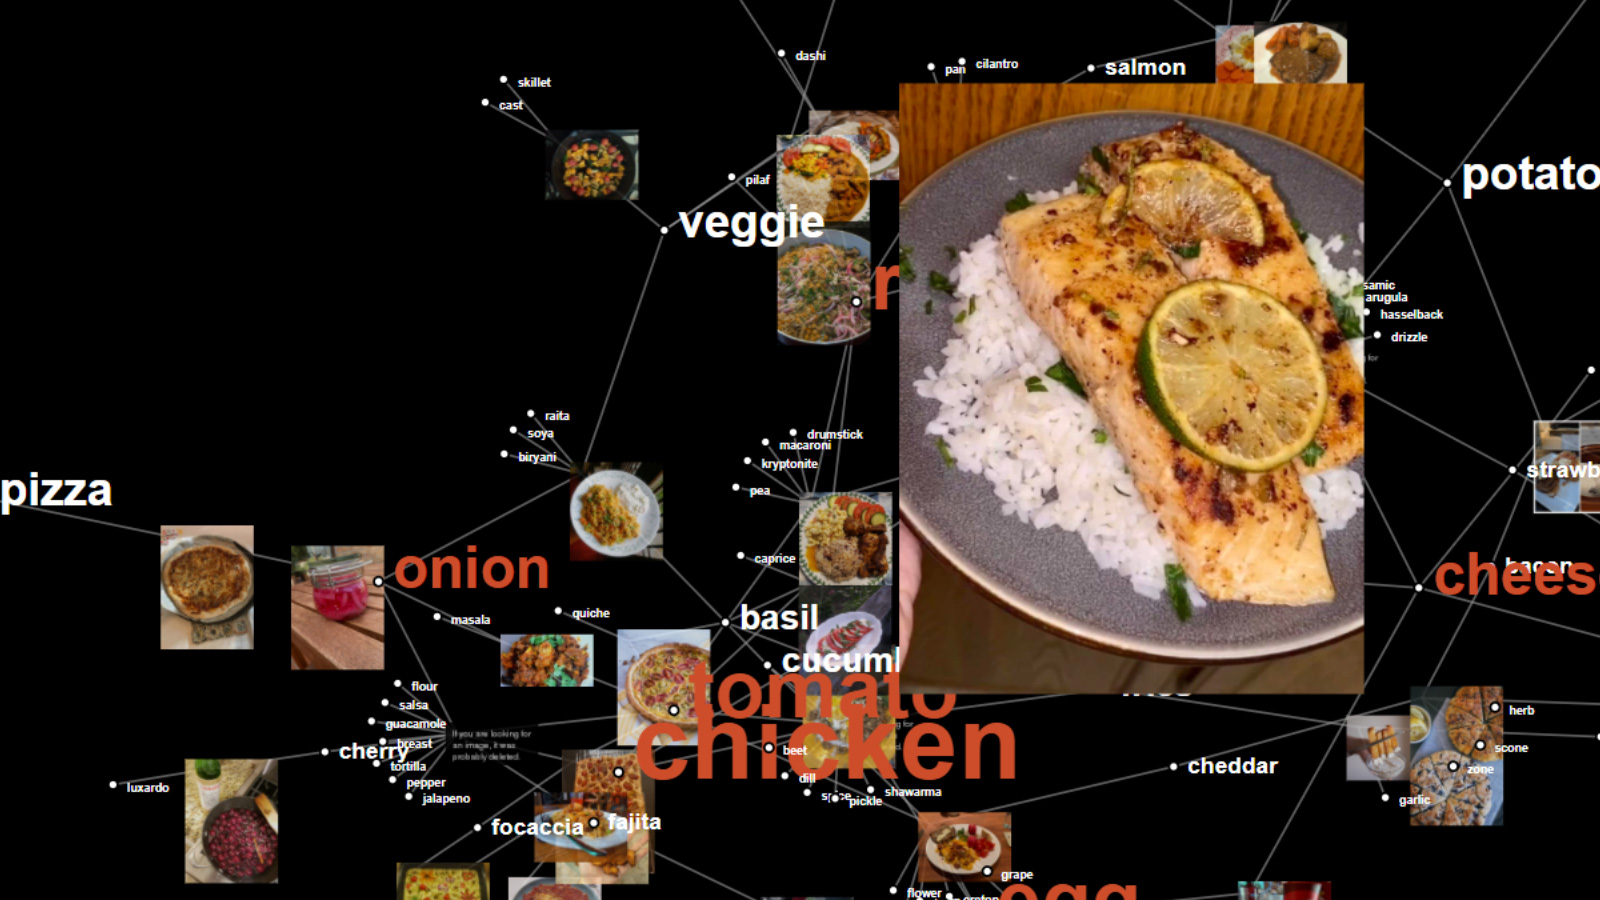
By displaying hundreds of posts/images of home-cooking food that people share on a Reddit community Covidcookery, we hope users can discover some fun from seeing what people are eating and how people treat food/cooking in their life during the pandemic. Moreover, to think about how the reality changes people’s diets and how sharing food has changed/enriched our life.
Prototypes
Data Processing and Visualization
To process our data, we firstly used Google Script to extract all post titles, images, and other metadata from the subreddit ranging from the subreddit's opening date to November 24 (data). Second, we used features of Spacy, including lemmatization and name recognition to identify all food names based on similarity of a number of food corpus that we collected from the web. After filtering keywords' similarity over 0.9, we also did several rounds of manual cleaning to ensure its accuracy.
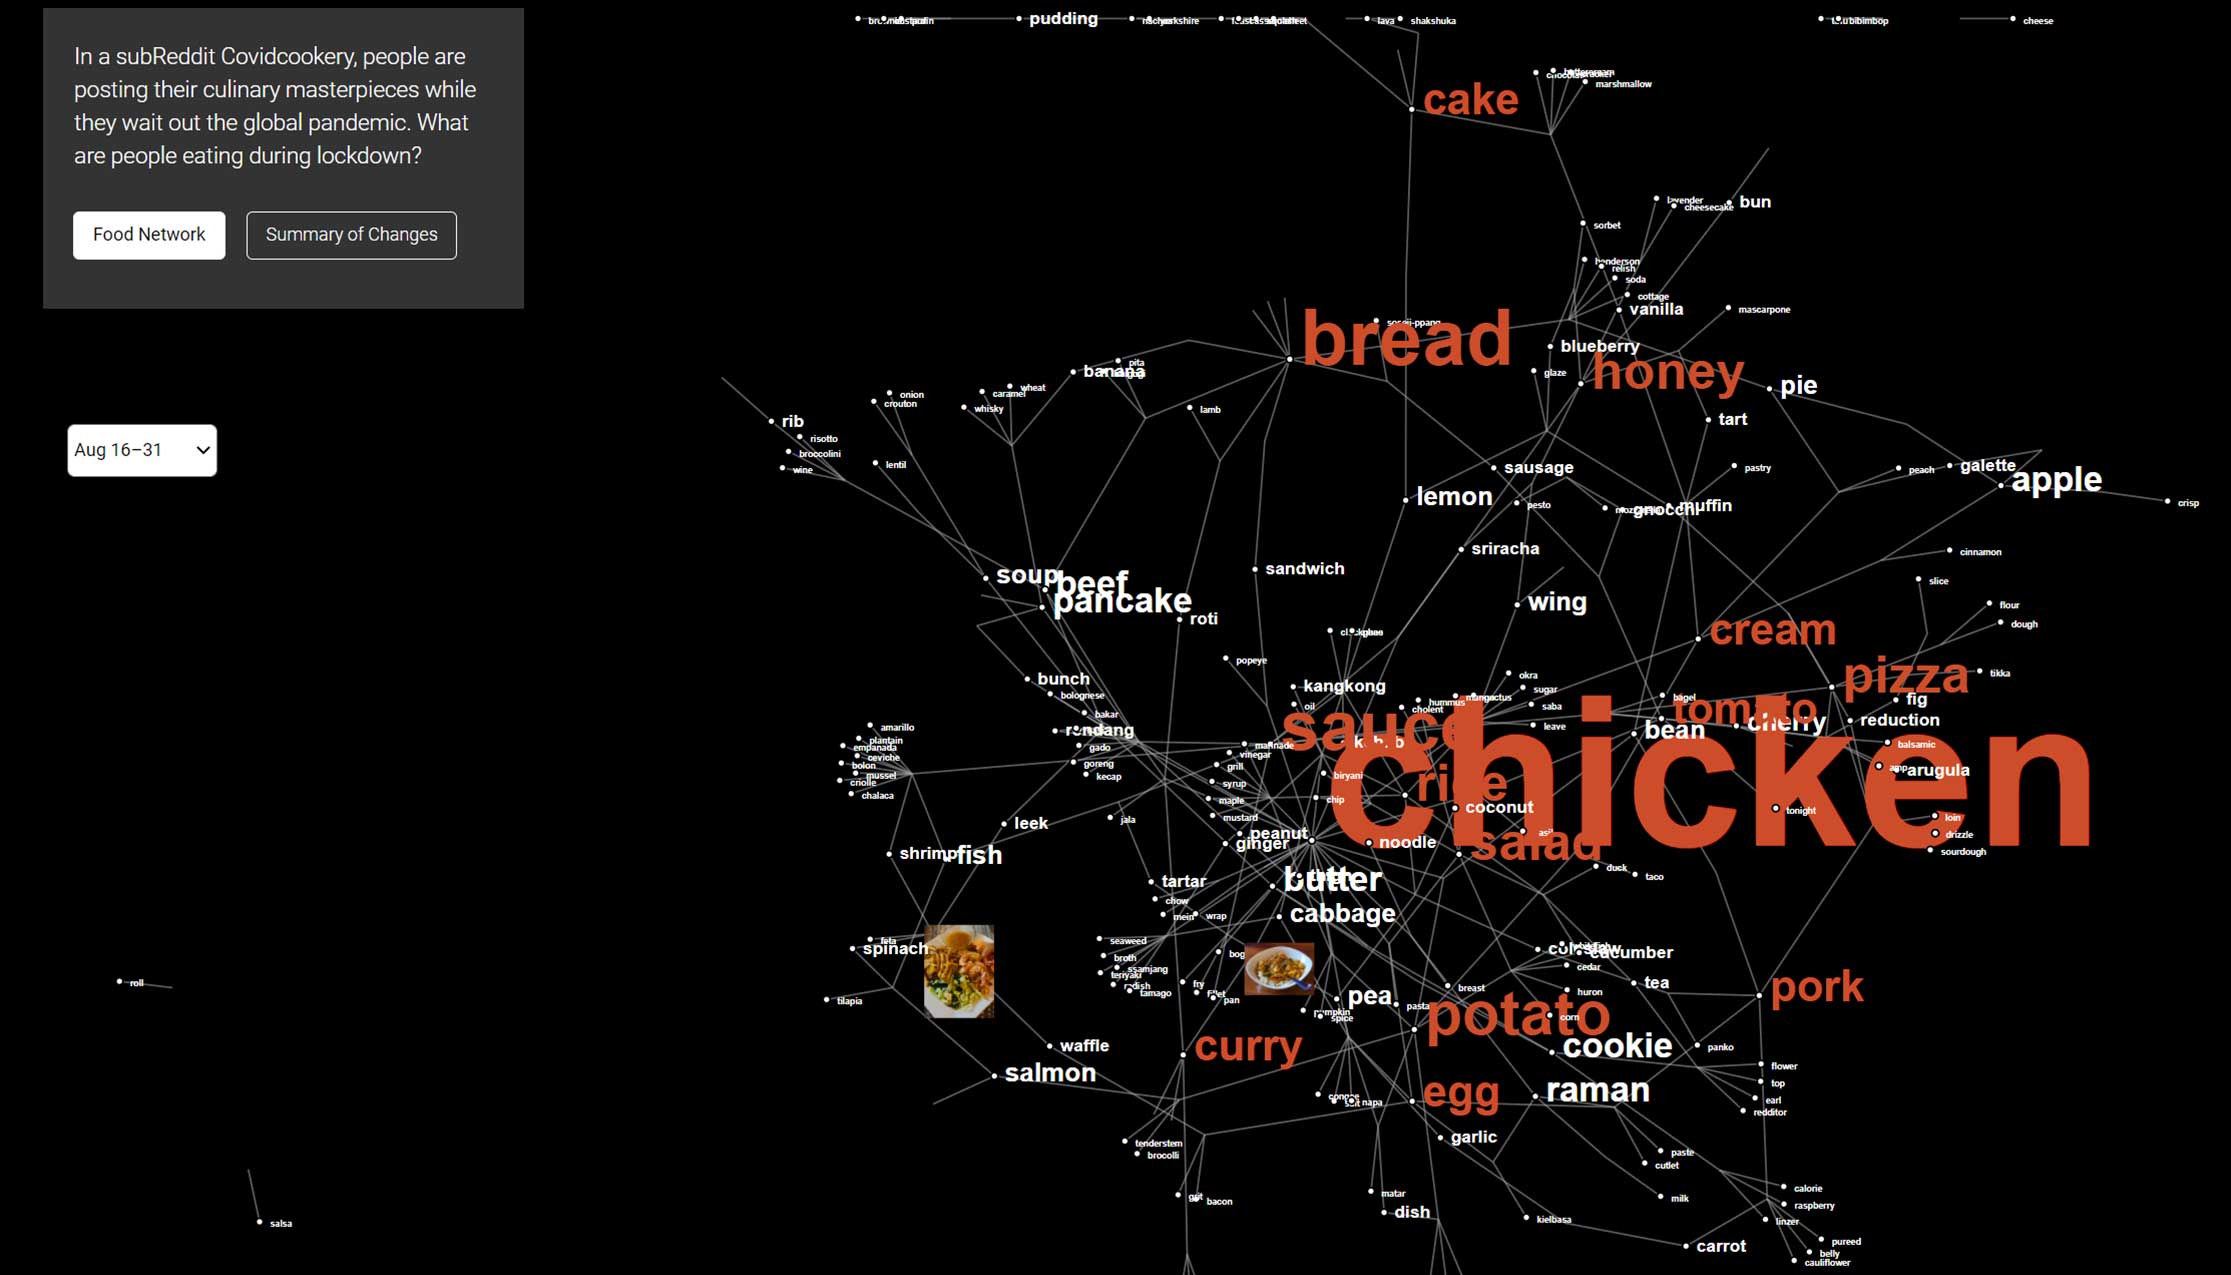
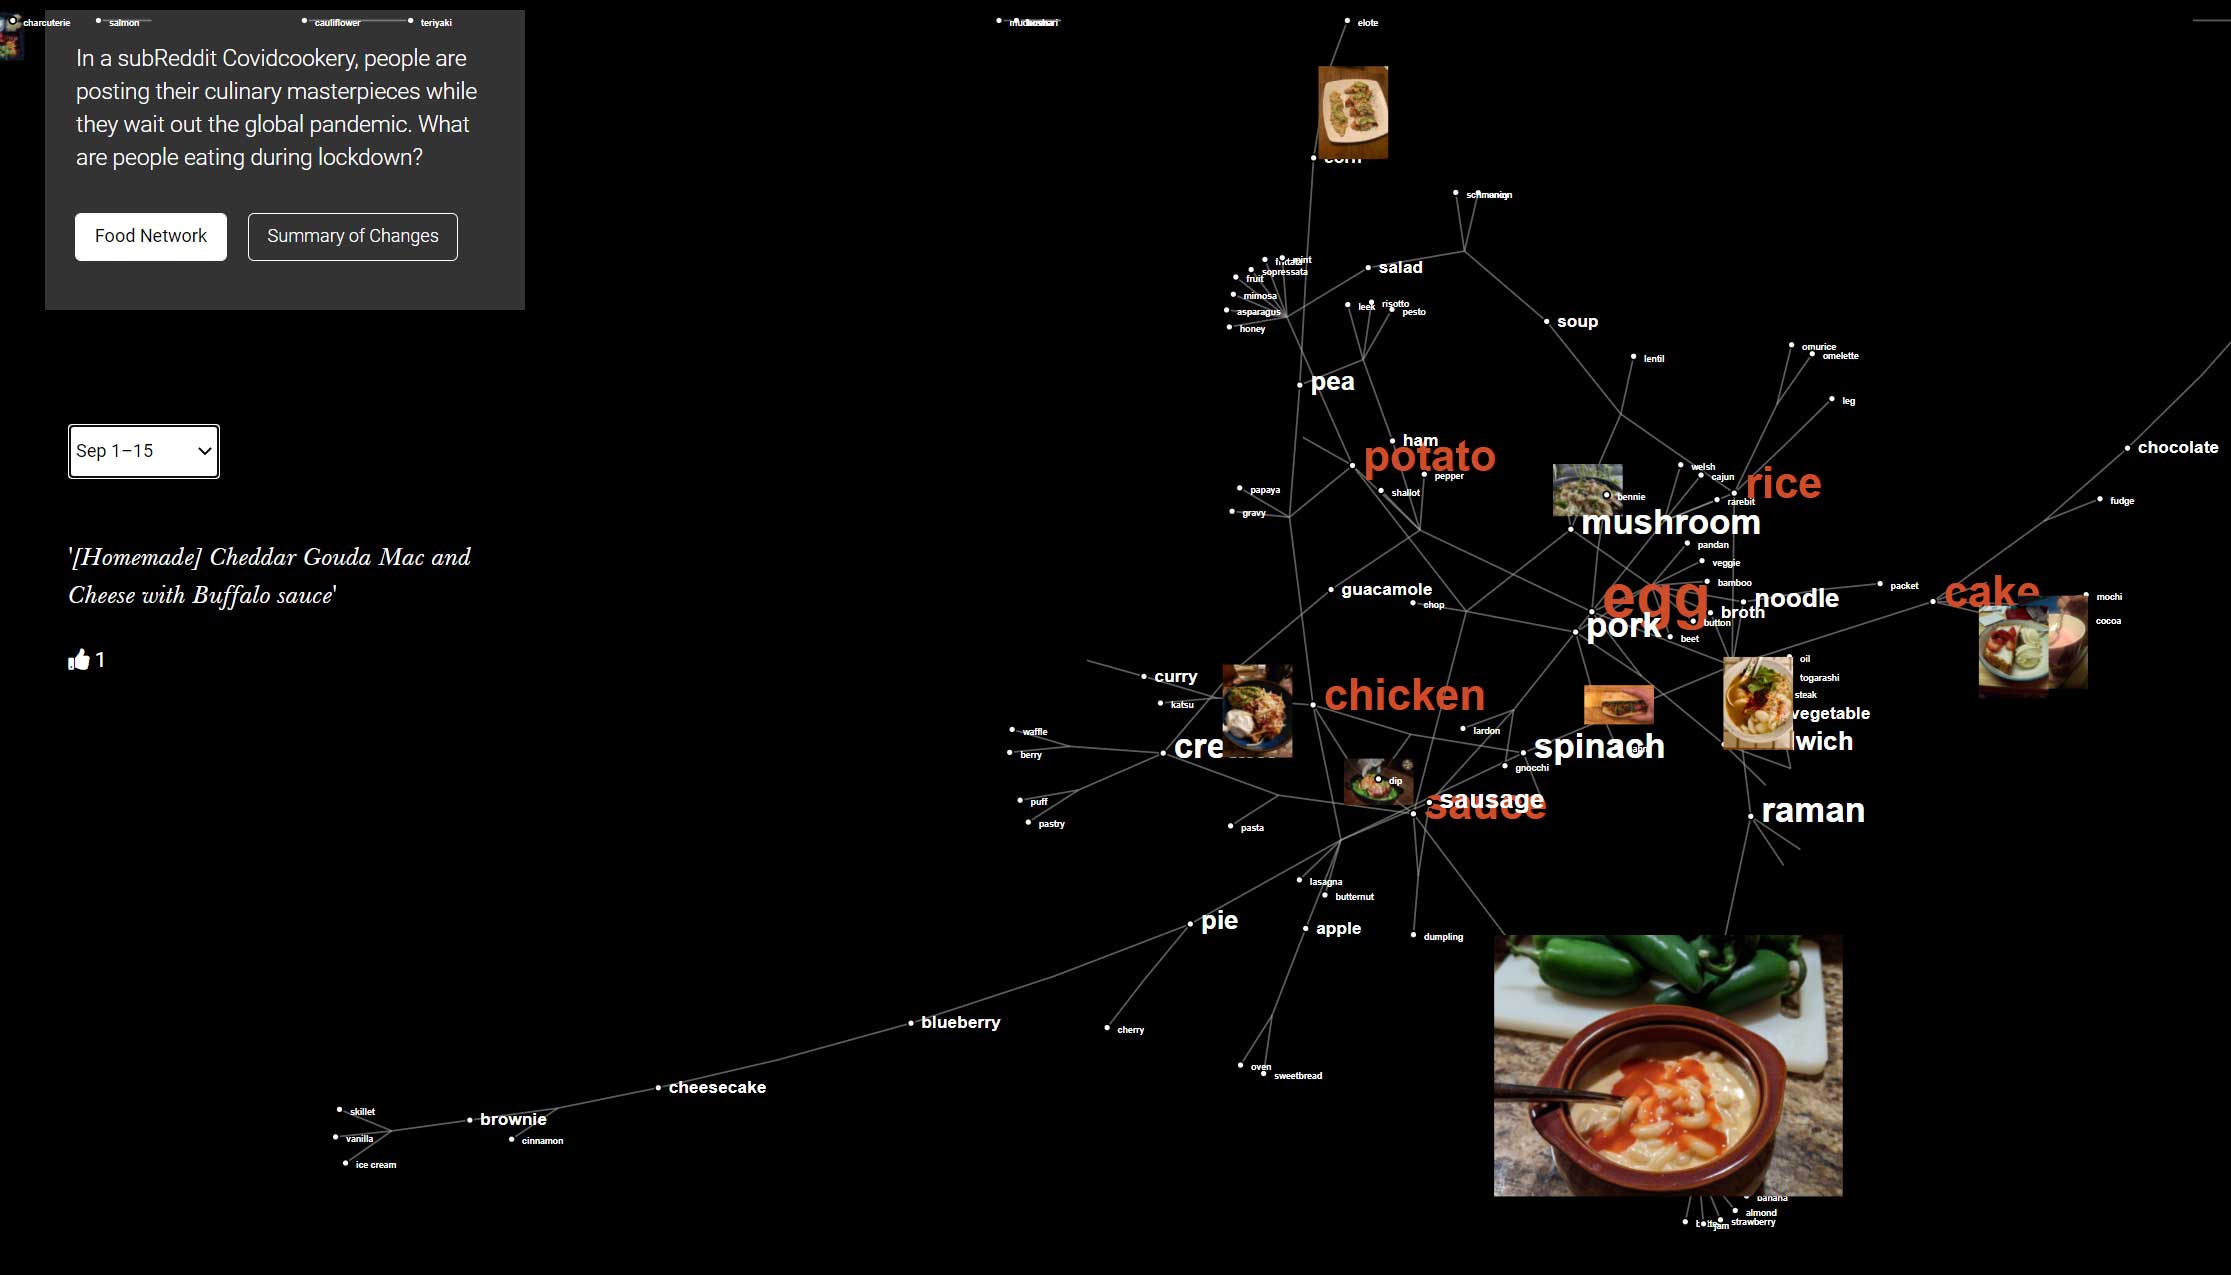
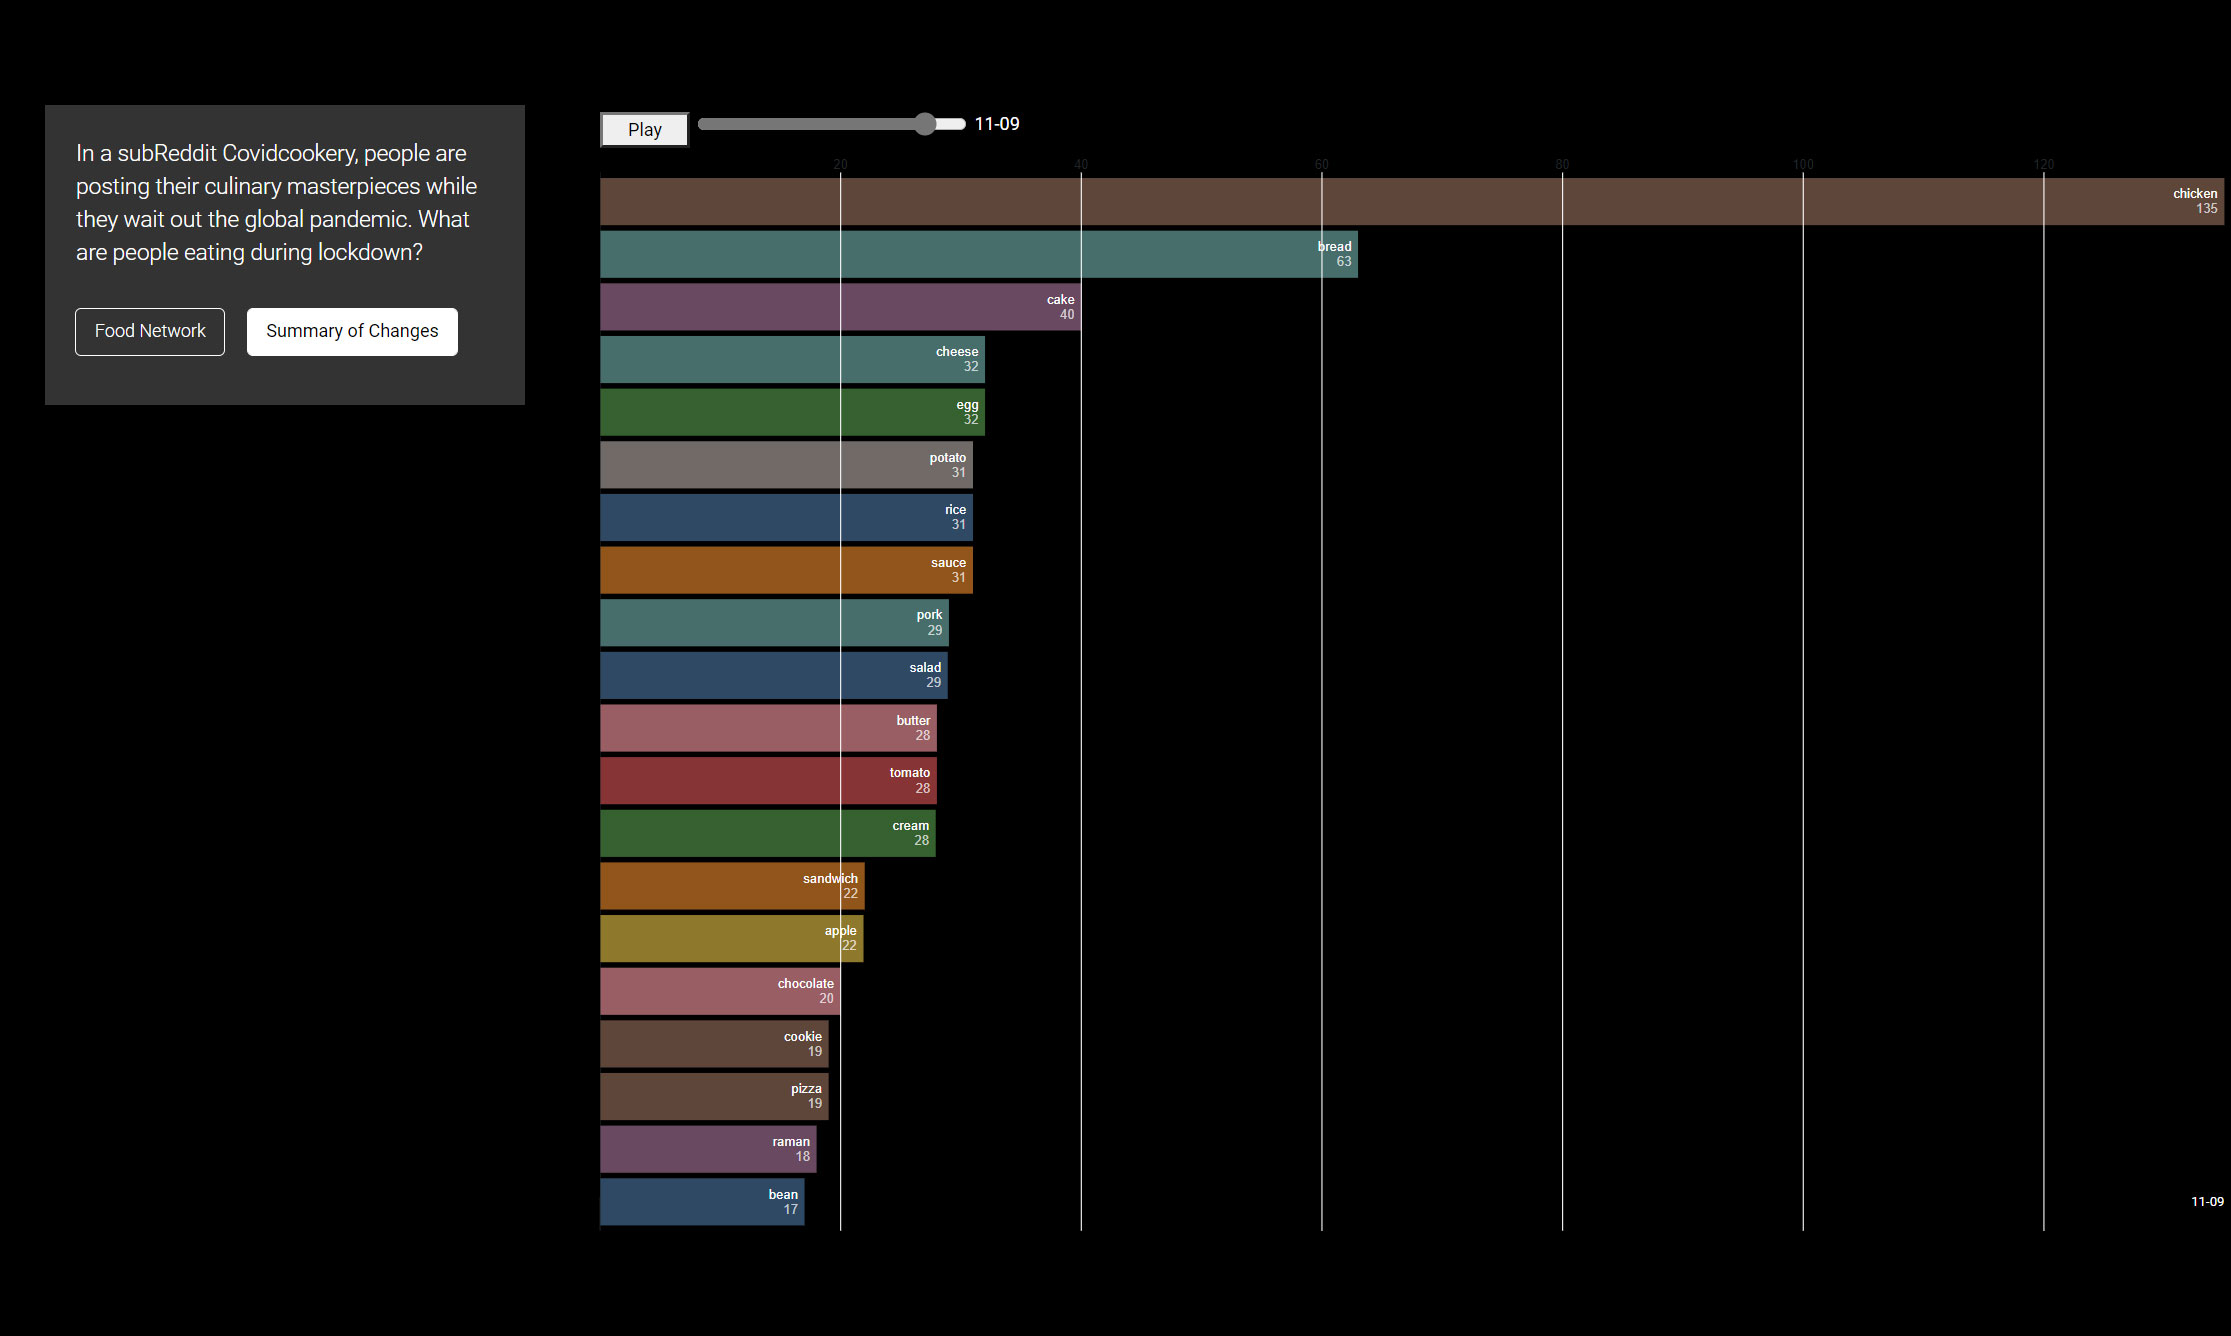
To visualize our data, we firstly converted our dataset into a network file by connnecting different dishes with the same food ingredients. Second, we aggregated times of food ingredients that have been used daily to perform the racing bar chart.
Finally, our visualization contains two sections, one force-directed graph of cooking dishes and ingredients and a racing bar chart showing the summary of top 20 food ingredients.

Visuals
